Prop firm calculators are the tools that separate disciplined traders from gamblers. When you know your exact position size, daily loss room, and drawdown buffer before every trade, you stop guessing and start managing risk with precision.
Every number in a prop firm challenge is connected. Your position size determines your risk per trade. Your risk per trade determines how many losses you can absorb. And your drawdown buffer determines how close you are to losing the account.
Here is a breakdown of every calculator a prop trader needs, how each one works, and why using them before every trading session is non-negotiable.
Key Takeaways
- Drawdown calculators tell you exactly how much room you have before breaching the max drawdown or daily loss limit.
- Position size calculators determine the exact lot size based on your account balance, risk percentage, and stop loss distance.
- Profit split calculators show your actual take-home pay after the firm takes their share.
- Challenge fee calculators help you compare the true cost of evaluations across different firms and account sizes.
- Using calculators before every session prevents the mental math errors that cause account blowups.
View Calculators
- Drawdown Calculator
- Daily Loss Limit Calculator
- Position Size Calculator
- Risk Per Trade Calculator
- Profit Split Calculator
- Challenge Fee Calculator
- Lot Size Calculator
- Risk of Ruin Calculator
- Drawdown Recovery Calculator
- Account Size Calculator
- Futures Risk Calculator
- Challenge Pass Probability Calculator
Drawdown Calculator Open Calculator
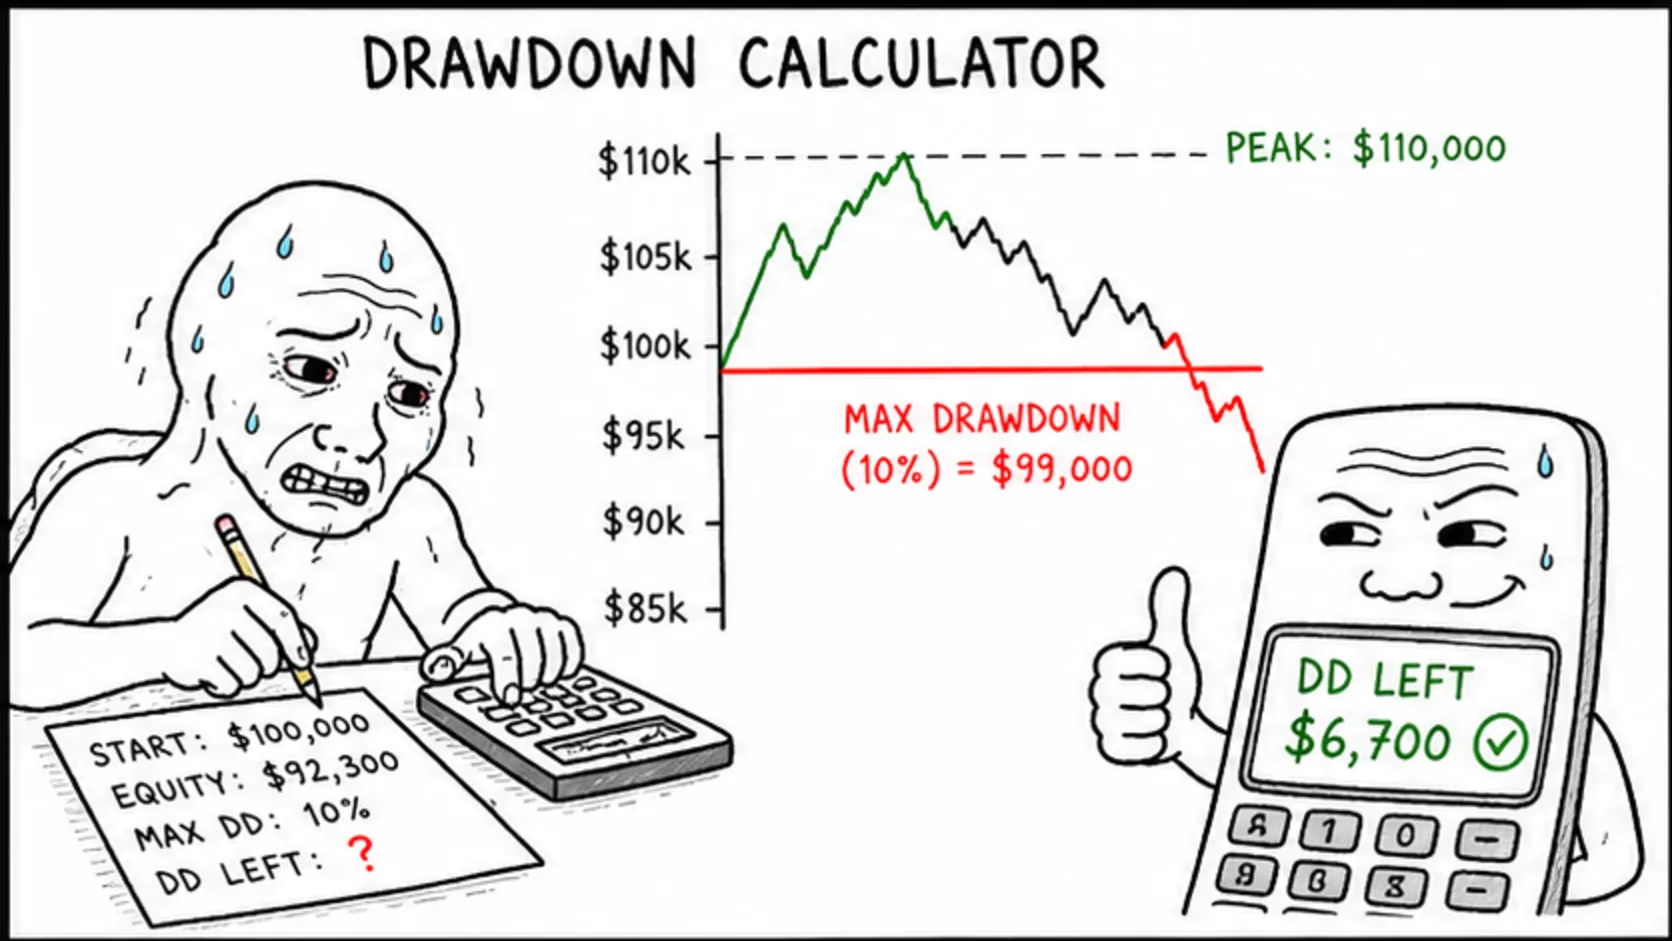
The drawdown calculator tells you exactly how much room you have between your current equity and the firm's max drawdown floor.
On a $50,000 account with 10% max drawdown, your floor is $45,000. If your current equity is $48,000, you have $3,000 of drawdown room remaining. That is your entire budget for losses.
The calculation changes with trailing drawdown. If you made $5,000 and your account peaked at $55,000, the trailing floor moves to $49,500. Your remaining room is now equity minus $49,500, not equity minus $45,000.
Check your drawdown room before every trade. Not once at the start of the day. Before every single trade. A position that was safe two hours ago might put you over the limit after earlier losses.
The drawdown calculator becomes even more critical during funded trading. During the evaluation, your only concern is hitting the target. During funded trading, you are managing risk indefinitely, and the drawdown is your permanent constraint.
Some advanced drawdown calculators let you input multiple open positions to see your combined floating risk. This is essential for traders who hold several positions simultaneously.
If your firm uses trailing drawdown, the calculator must account for your highest equity point, not just your starting balance. Make sure you are using the right calculation method for your specific firm.
A common mistake is calculating drawdown from the starting balance when the firm uses trailing drawdown from peak equity. This mismatch causes traders to think they have more room than they actually do, right up until the account closes.
Daily Loss Limit Calculator Open Calculator
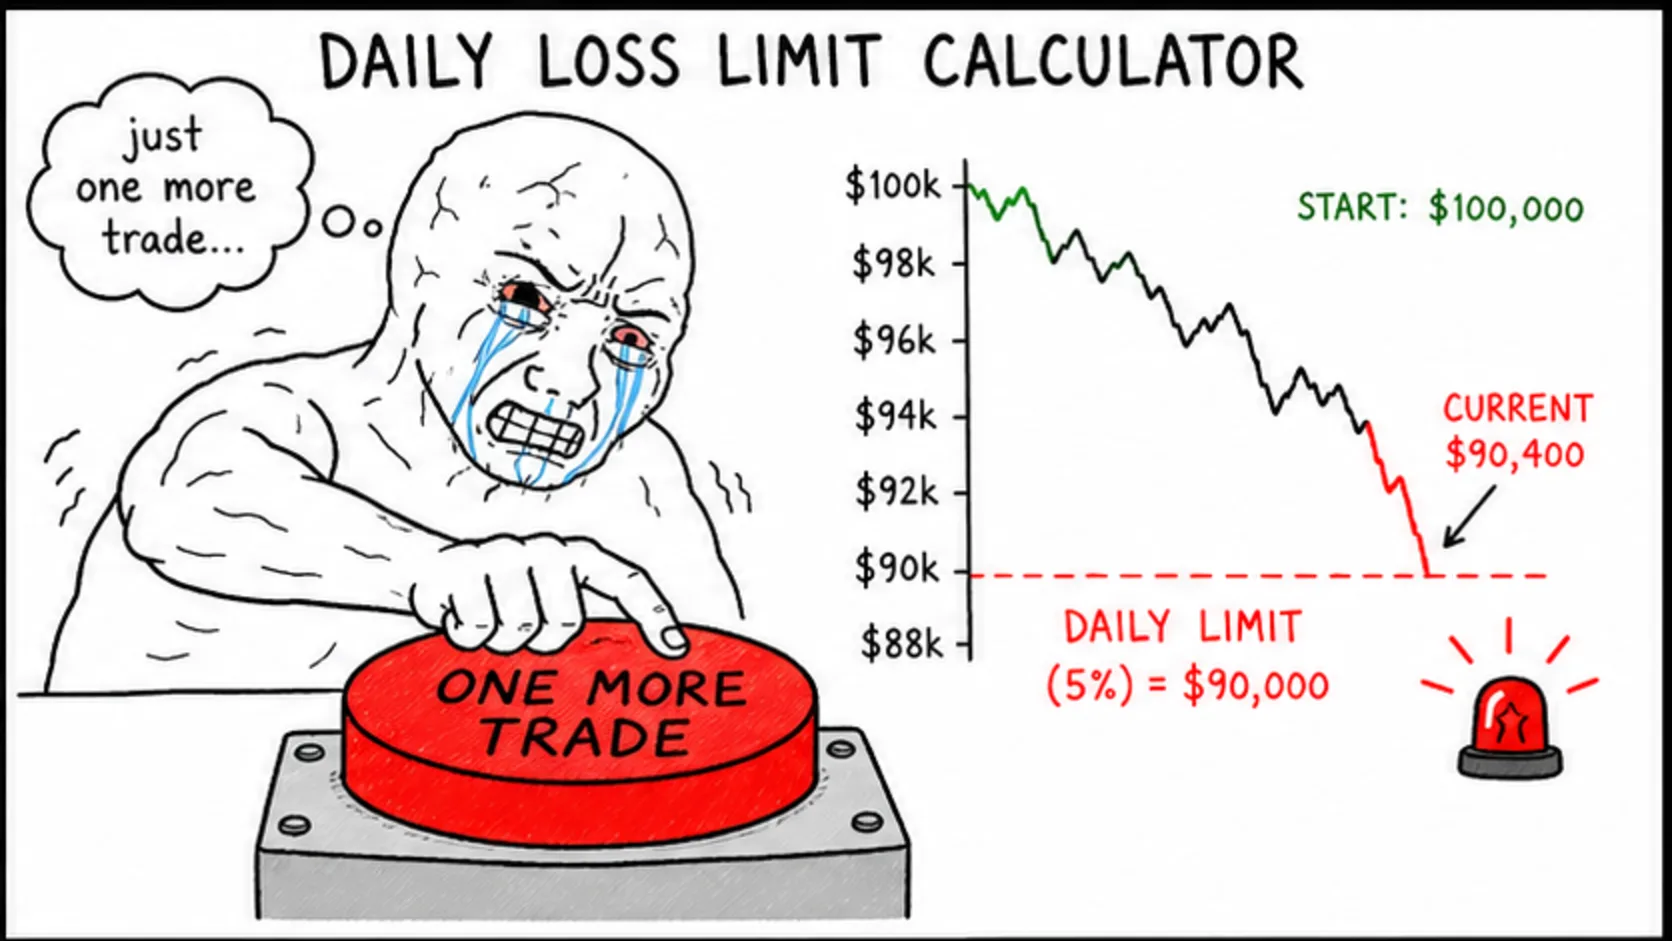
The daily loss calculator tracks how much you have lost today relative to the firm's daily loss limit.
On a $50,000 account with a 5% daily loss limit, you can lose $2,500 per day. If you are down $1,800 after three trades, you have $700 remaining before the account closes.
The daily loss limit resets at midnight server time, which varies by firm. Some use New York time, others use London or UTC. Know which timezone applies to your account.
Set a personal daily loss limit at 60-70% of the firm's limit. If the firm allows $2,500, stop trading at $1,500-$1,750. The buffer protects you from the one extra trade that ends your challenge.
The daily loss calculator should be updated in real time as you trade. After each closed trade, recalculate your remaining daily loss room before placing the next position.
Some traders colour-code their daily loss tracking. Green means you have plenty of room. Yellow means you are at 50-70% of your personal limit. Red means stop trading regardless of how good the next setup looks.
This colour system sounds simple because it is. Simple systems work during emotional moments. Complex systems get ignored when you are frustrated after three consecutive losses.
Position Size Calculator Open Calculator
The position size calculator determines your exact lot size based on your account balance, risk percentage, and stop loss distance in pips.
The formula is straightforward. Account risk amount divided by stop loss pips divided by pip value equals your lot size. On a $50,000 account risking 1% with a 50-pip stop, your risk is $500 divided by 50 pips, which is $10 per pip or approximately 0.10 standard lots on EUR/USD.
Never eyeball position sizes. The difference between 0.10 lots and 0.50 lots on a 50-pip stop is $500 versus $2,500. That is the difference between a manageable loss and a blown account.
Use this calculator before every trade, even if you think you know the answer. The mental math under pressure is unreliable.
Different instruments have different pip values. EUR/USD is roughly $10 per pip per standard lot. GBP/USD is similar. But USD/JPY is approximately $6.50 per pip per lot because of the exchange rate difference.
This means a 50-pip stop loss on EUR/USD at 0.10 lots risks about $50. The same 50-pip stop on USD/JPY at 0.10 lots risks about $32.50. The position size calculator accounts for these differences automatically.
If you trade futures instead of forex, the calculation uses tick values instead of pips. One tick on the E-mini S&P 500 (ES) is worth $12.50 per contract. A 4-tick stop on 2 contracts risks $100.
The key principle is the same regardless of instrument. Define your risk in dollars first, then work backwards to the lot or contract size. Never start with "I want to trade 2 lots" and then calculate your risk afterward.
Risk Per Trade Calculator Open Calculator
The risk per trade calculator helps you determine how much of your account to risk on each individual position.
The standard recommendation is 1-2% per trade. On a $50,000 account, that is $500-$1,000 per trade. This keeps you in the game long enough to let your edge play out over 20+ trades.
Risking more than 2% per trade dramatically increases your risk of ruin. A trader risking 5% per trade with a 40% win rate has a significantly higher probability of blowing the account before becoming profitable.
The calculator shows you the mathematical probability of hitting your drawdown limit based on your risk percentage and win rate. The numbers are sobering and should convince anyone to size down.
Profit Split Calculator Open Calculator
The profit split calculator shows your actual take-home earnings after the firm takes their percentage.
At an 80/20 split, you keep 80% and the firm takes 20%. On $3,000 of monthly profit, you receive $2,400 and the firm keeps $600. At a 90/10 split on the same profit, you keep $2,700.
The difference between a 70% and 90% profit split on $5,000 monthly profit is $1,000 per month or $12,000 per year. That is a significant amount that should factor into your firm selection.
Some firms offer scaling profit splits that increase as you demonstrate consistency. A firm that starts at 80% and scales to 90% after six months of profitability is effectively paying you more the longer you stay funded.
When comparing firms, use the profit split calculator with your realistic monthly profit projection. A firm with a higher split but stricter rules might earn you less than a firm with a lower split but more achievable targets.
Factor in payout frequency as well. A firm that pays every 14 days with an 80% split gives you faster access to earnings than a firm that pays monthly at 85%. Cash flow matters when you are building a trading career.
Challenge Fee Calculator Open Calculator
The challenge fee calculator helps you compare the true cost of evaluations across different firms and account sizes.
The evaluation fee is only part of the cost. Consider reset fees if you fail, the probability of passing based on the firm's rule strictness, and the time value of money spent on challenges you do not pass.
A $200 evaluation with a 10% pass probability has an expected cost of $2,000 to get funded. A $400 evaluation with a 25% pass probability has an expected cost of $1,600. The cheaper fee is not always the better deal.
Lot Size Calculator Open Calculator
The lot size calculator converts your risk parameters into standard, mini, or micro lot sizes for your specific trading platform.
One standard lot on EUR/USD is approximately $10 per pip. One mini lot is $1 per pip. One micro lot is $0.10 per pip. Knowing these values lets you calculate your exact dollar risk for any position size.
Some firms impose maximum lot sizes per position. The calculator helps you stay within both your risk parameters and the firm's position limits simultaneously.
Risk of Ruin Calculator Open Calculator
The risk of ruin calculator shows the probability of blowing your account based on your win rate, risk-reward ratio, and risk per trade.
A trader with a 50% win rate, 1:2 risk-reward, and 2% risk per trade has a risk of ruin below 1%. The same trader risking 5% per trade has a risk of ruin above 20%.
This calculator is the most important tool for new prop traders because it demonstrates mathematically why position sizing matters more than entry timing.
The difference between a funded trader and a trader who keeps buying evaluations is often just 1-2% in risk per trade. According to the Bank for International Settlements, the majority of retail forex traders lose money, and excessive position sizing is a primary driver.
Drawdown Recovery Calculator Open Calculator
The drawdown recovery calculator shows how much profit you need to recover from a loss. The maths is asymmetric and depressing.
A 10% loss requires an 11.1% gain to recover. A 20% loss requires a 25% gain. A 50% loss requires a 100% gain. The deeper the drawdown, the harder the recovery.
This calculator is a reality check for traders who think "I can always make it back." The numbers show that preventing large drawdowns is far more important than chasing large gains.
The recovery calculator also helps with emotional regulation. When you are in a drawdown, seeing that a 15% loss requires an 17.6% gain to recover can motivate you to cut losses rather than holding and hoping.
Use the recovery calculator before each trading day to understand where you stand. If your account is down 5% and your firm has a 10% max drawdown, you have exactly 5% remaining. Every trade from this point carries heightened risk.
The calculator can also help you set realistic daily targets. If you need to recover $2,500 on a $50,000 account, and you trade 20 days per month, you need to average $125 per day in profit. That is achievable with consistent, well-sized trades.
But if you are trying to recover $5,000 on the same account in 10 days, you need $500 per day. That level of daily pressure leads to overtrading and further losses. The recovery calculator shows you when to accept the drawdown and grind back slowly.
Use this calculator whenever your account drops more than 3% to understand the actual effort needed to recover. The answer will motivate you to cut losses faster.
Account Size Calculator Open Calculator
The account size calculator helps you determine which account size matches your trading style, risk tolerance, and financial situation.
Consider your average daily profit target, the number of trades you typically take, and your risk per trade. If you trade 2-3 times per day with 1% risk, a $50,000 account gives you $500 risk per trade and a realistic daily target of $200-$400.
Choose an account size where the dollar amounts do not trigger emotional decisions. If seeing a $500 loss on screen makes you anxious, the account is too large for your current psychology.
The account size calculator should also factor in the firm's specific rules. Some firms have higher drawdown percentages on smaller accounts and tighter drawdowns on larger accounts.
For beginners, the recommended approach is to start with the smallest account that still feels meaningful. If a $100 profit day motivates you, a $10,000 or $25,000 account is sufficient.
You can always scale up later. The account size you start with does not limit the account size you end up with if the firm offers scaling plans.
Remember that the firm's rules apply proportionally regardless of account size. A 5% daily loss limit is the same percentage on $10,000 as $200,000. The difference is only psychological.
The calculators on this page are free and designed specifically for prop traders. Use them alongside the prop firm rules guide to plan your risk parameters before every evaluation or funded trading session.
Futures Risk Calculator Open Calculator
The futures risk calculator measures your dollar risk per trade using tick values instead of pips. One tick on the E-mini S&P 500 is $12.50 per contract. A 4-tick stop on 2 contracts risks $100. That is the entire calculation, and you should do it before every single futures trade.
Futures prop firms like Topstep, Apex, and Earn2Trade use trailing drawdown measured in dollars. The tick-based calculation is essential because the relationship between ticks and dollars changes with every contract type.
Challenge Pass Probability Calculator Open Calculator
The challenge pass probability calculator estimates your chances of passing a prop firm evaluation based on your actual trading statistics. It combines your win rate, risk-reward ratio, position sizing, and the firm's specific rules into a single probability estimate.
Most traders drastically overestimate their chances of passing. This calculator shows you the honest mathematical probability. If the number is below 40%, you have work to do before buying another challenge.
